Analyzing results
You can explore and analyze the scanning results after the scan process is completed (or before it’s finished, because the system let’s you work concurrently with that process). In this section I’ll explain the different windows you have to work with the results.
There’s a complete tab for results in w3af, and as there’re a lot of information to analyze, this tab is also divided in tabs, as you can check the Knowledge Base, see the site structure, or navigate through the individual requests and responses.
Browsing the Knowledge Base
The Knowledge Base is a collection of discovered items, that can be classified in Vulnerabilities, Informations, and other stuff. The KB Browser tab lets you dive into this information.
In the left part of the window [1] you’ll find the information of the Knowledge Base. By default it only shows you the vulnerabilities and informations, but you can enable also the miscellaneous stuff or hide any of them, using the checkboxes above the info [2].
The information is grouped in a tree way, but you have different nodes to expand. If you select one of the items, and that item corresponds to a HTTP request originated by the scanning, you will see in the right part of the window all the information about that request and its response (more info about this below).
The items in the tree has a color that indicates the severity of the issue: black for informations, orange for low-severity vulnerabilities, and red for medium or high severity ones. As they’re in a tree structure, each node in the tree will have the color of the more severe of its children.
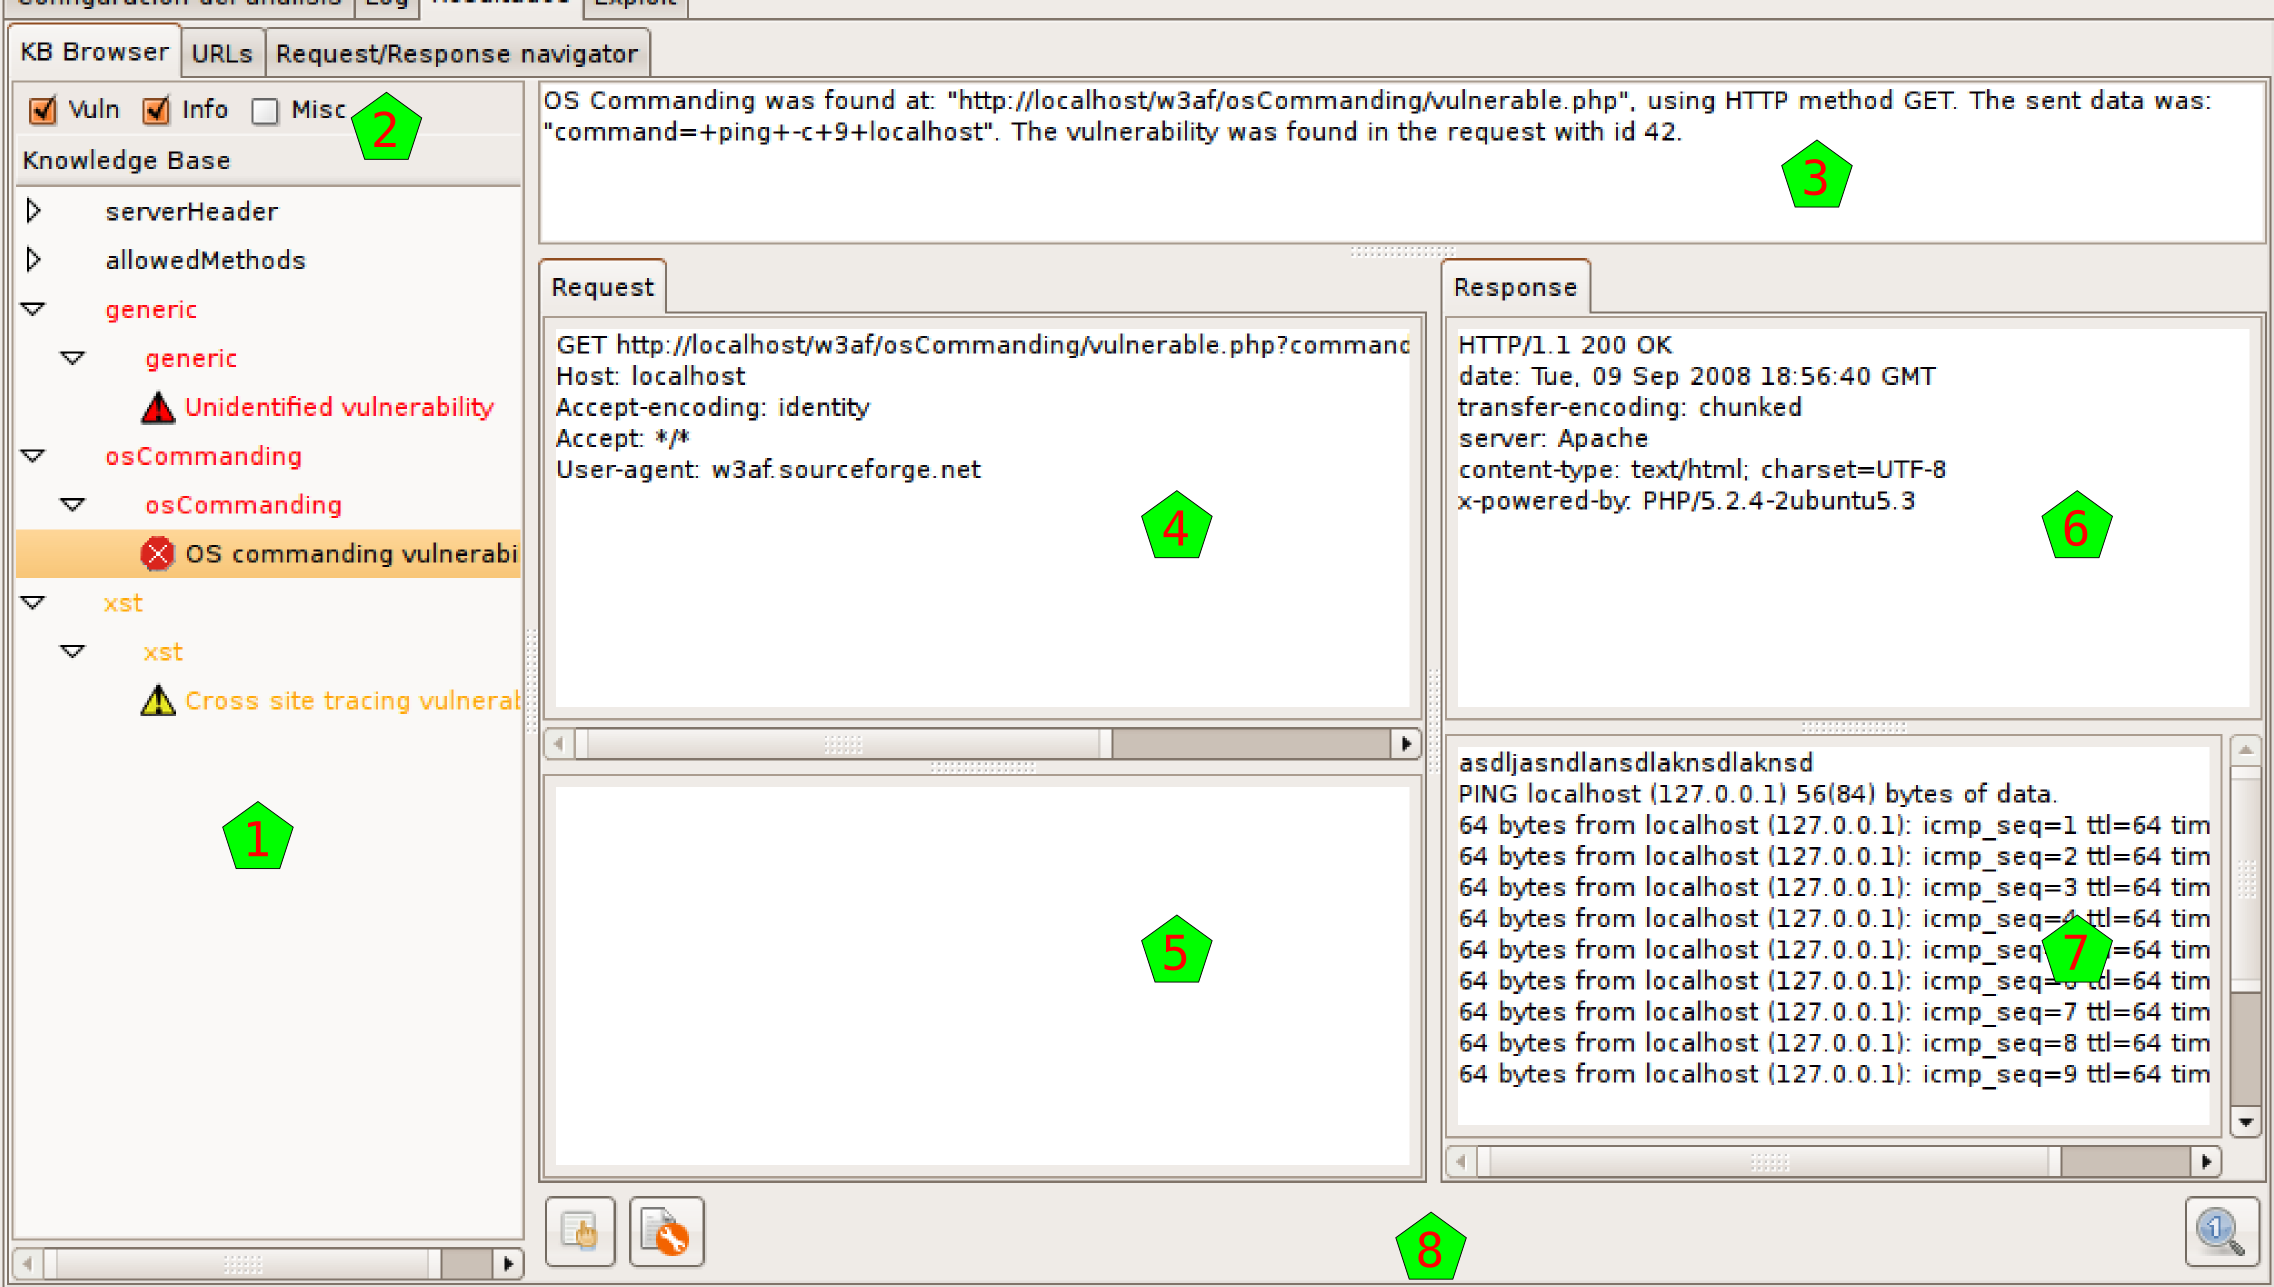
As said above, when you click on a tree node that actually is generated by a HTTP request, you can see in the left part of the window information about this request and its response. This part is separated in different panes.
Above everything [3] you have general information about when the request was found (actually, this is the same line that you can find in the logs regarding this request). Below that info you have the request headers [4], the request body [5], the response headers [6], and the response body [7].
At the bottom [8] you have some buttons that will enable you to make some actions with the request and response. With the buttons at the left you can send the HTTP Request to the Manual and Fuzzy Request tools. With the button at the right you can send everything to the Compare tool. These buttons refer to the same tools that have the same icon in the toolbar, but actually send the shown information to that tools, which is very handy.
This structure, the HTTP request and response with both panes each, and the buttons to use that information with other tools, is repeated all over the program interface, so it’s good to get used to it.
Site structure
The URLs tab shows the structure of the site that the system worked on. It’s separated In two parts, but both parts show actually the same information, although they show it in different ways.
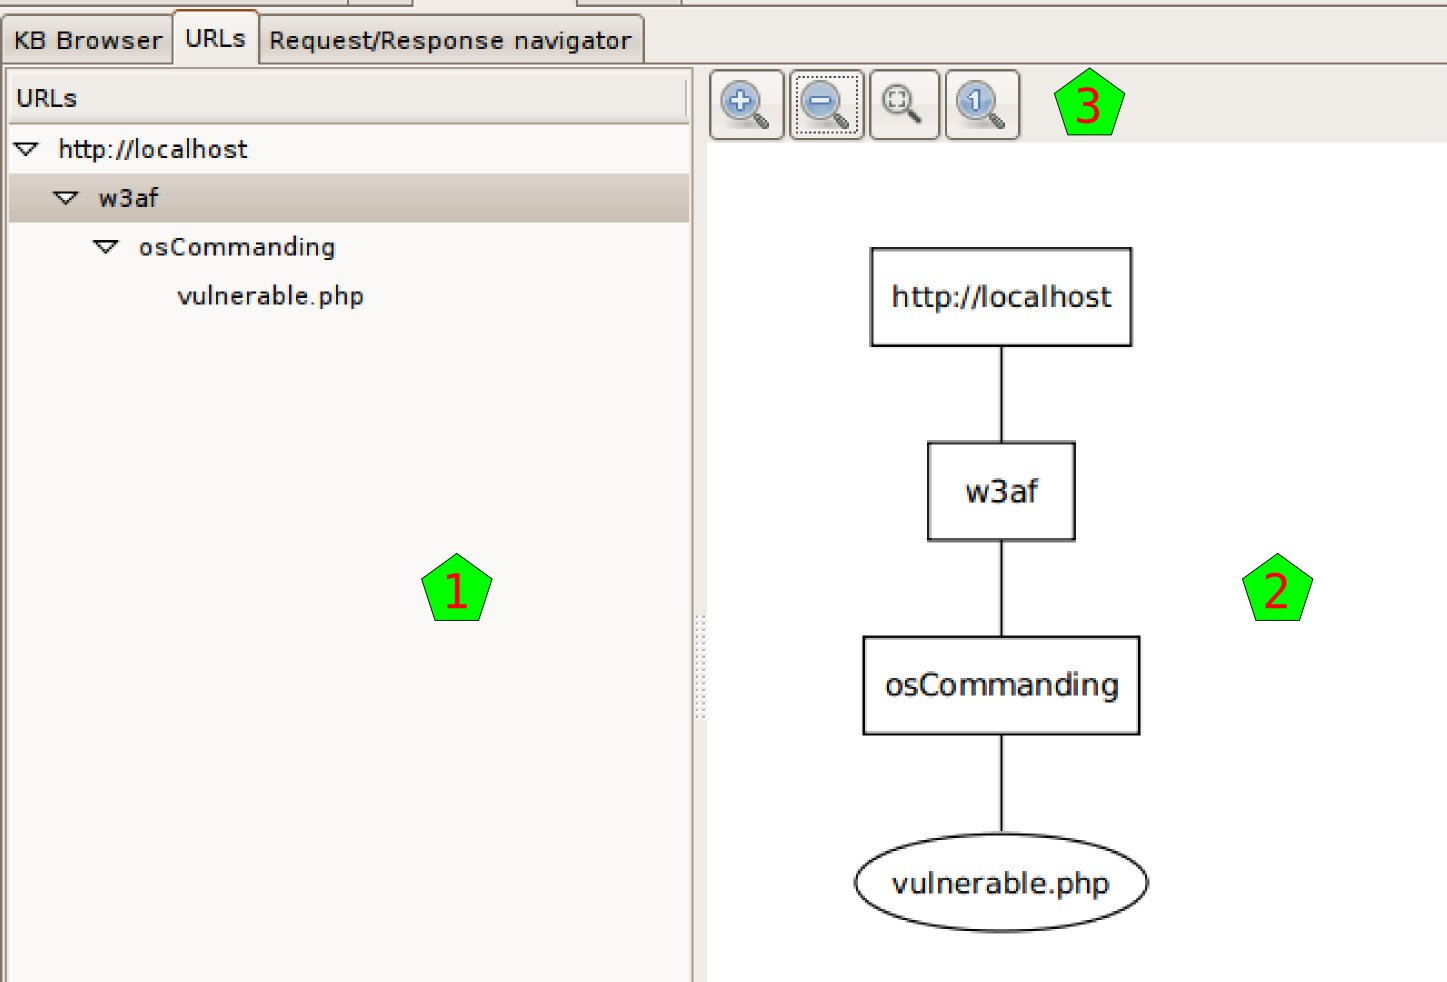
At the left [1] you can see the site structure in the old fashion way: with a tree-like list of nodes.
At the right [2] you have the same information but graphically. Above the drawing [3] you have different buttons that help you to see the graph better: zoom in, zoom out, fit all the graph in the window, and show the graph in the original size.
Requests and responses
In this window you will be able to search for any request (and the associated response) that the system had generated during the scanning.
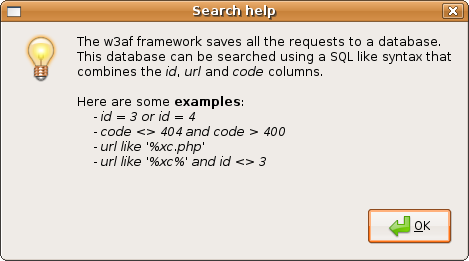
In the upper text entry [1] you can insert a query to search the knowledge database for requests and responses. You have a flexible syntax to build your query, for details about the syntax, click on the Help button on the right, and a similar window to the one shown here will be presented to you.
After you enter the query, and hit the Find button, the system will retrieve all the requests and responses that match, and will present them to you in the results list [2]. If you click on any of those results, you’ll see the request and response details [3].
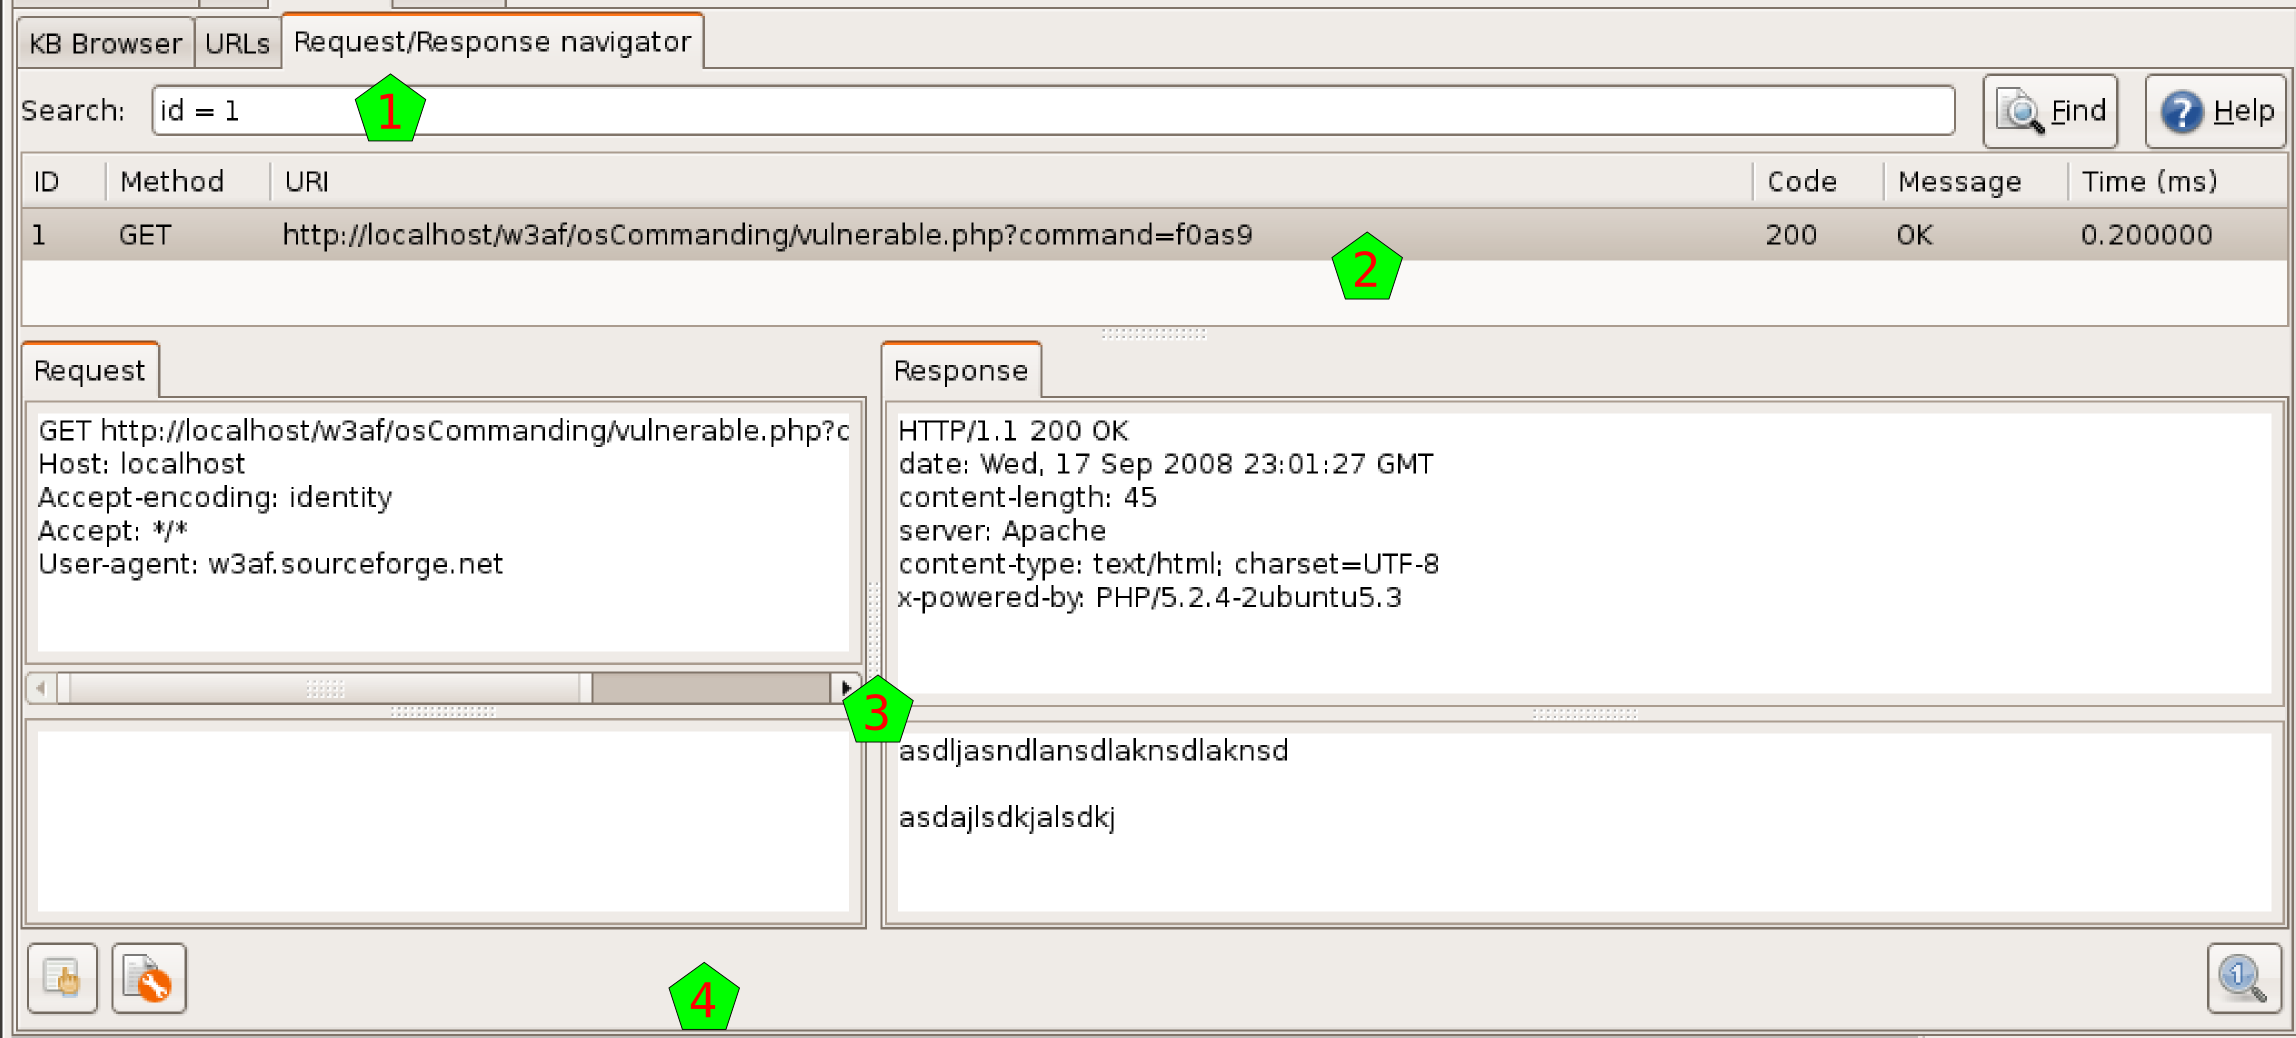
As usual when seeing requests and responses, you’ll have the tool buttons [4] to use these data in the already familiar tools.